


Earlier this week, my attention was caught by a CNBC article Firms are bringing production back home because of the Ukraine war, China’s slowdown. While it was not a complete surprise to me to learn about reshoring, I found some of the data points coming in the article very interesting. Here are some of them speaking about US and UK trends.
Reshoring Examples from US and UK
One of the interesting (and remarkable ones) was that reshoring was coming in the US S&P 500 earning news and transcripts more often than AI which was running the top news since the beginning of this year.
In an analysis of S&P 500 earnings call transcripts, Bank of America said mentions of “reshoring” — in which companies move production from overseas to the countries where goods are sold — were up 128% in the first quarter of the year against the same time a year ago.
Mentions of artificial intelligence, meanwhile, were up 85% year over year, according to an April 29 note by BofA strategist Savita Subramanian.
UBS also examined the trend, with many senior executives in different sectors surveyed by the bank intending to move parts of the supply chain closer to home — 78% in Europe, 70% in the U.S. and 54% in China plan to do so, according to a research note published on March 2. The bank polled more than 1,600 executives.
At the same time in the UK, we can see examples of companies bringing manufacturing back locally, especially for small orders.
In the U.K., 40% of manufacturers surveyed by industry group Make UK said they had sourced more goods domestically over the past year, and around the same proportion plan to over the next year. Make UK surveyed 137 companies in January and February.
For British audio equipment-maker BishopSound, moving some of its supply chain from China to Yorkshire in northern England has improved its cashflow because minimum order quantities are lower domestically.
“In the past, we imported finished plywood speakers from 7,000 miles away in China. We are now manufacturing all our speakers in the North of England and using British-made components wherever possible. We stopped importing finished wooden speakers last December,” company founder Andrew Bishop told CNBC via email.
PLM, product data, and supply chain connection
Product data and Bill of Materials (BOM) information play a crucial role in supply chain analysis, ensuring efficient and effective management of the entire process. Accurate product data provides detailed information about the specifications, characteristics, and attributes of a product. It includes data such as dimensions, weight, materials, and functionality. This information is vital for supply chain professionals to make informed decisions regarding inventory management, demand forecasting, and procurement. By having comprehensive product data, organizations can optimize their supply chain operations, reduce costs, and enhance customer satisfaction.
Bill of Materials is a key element of this product data and is essential in supply chain analysis as it provides a detailed breakdown of all the components, subassemblies, and raw materials required to manufacture a product. The BOM specifies the quantity, part numbers, and relationships between the different items in the manufacturing process. Having accurate BOM information enables supply chain managers to plan and coordinate the sourcing, production, and assembly processes effectively. It helps in determining the required inventory levels, ensuring the timely availability of components, and avoiding stock-outs or production delays. By leveraging BOM information, supply chain professionals can optimize production schedules, minimize lead times, and streamline the overall supply chain flow.
The challenge is that the supply chains that were in place were built for the old model. The main characteristic of the old system is that it is not connecting these two pieces together. Most PLM systems are still only focusing on traditional functions such as release management and change control. The connectivity between the supply chain and early design phases is critical to make companies optimize for the supply chain. PLM systems have little or no ability to perform complex supply chain analysis at different stages of product lifecycle development. Also, PLM technology and infrastructure are 25-30 years old SQL databases don’t provide a way to make such an analysis too.
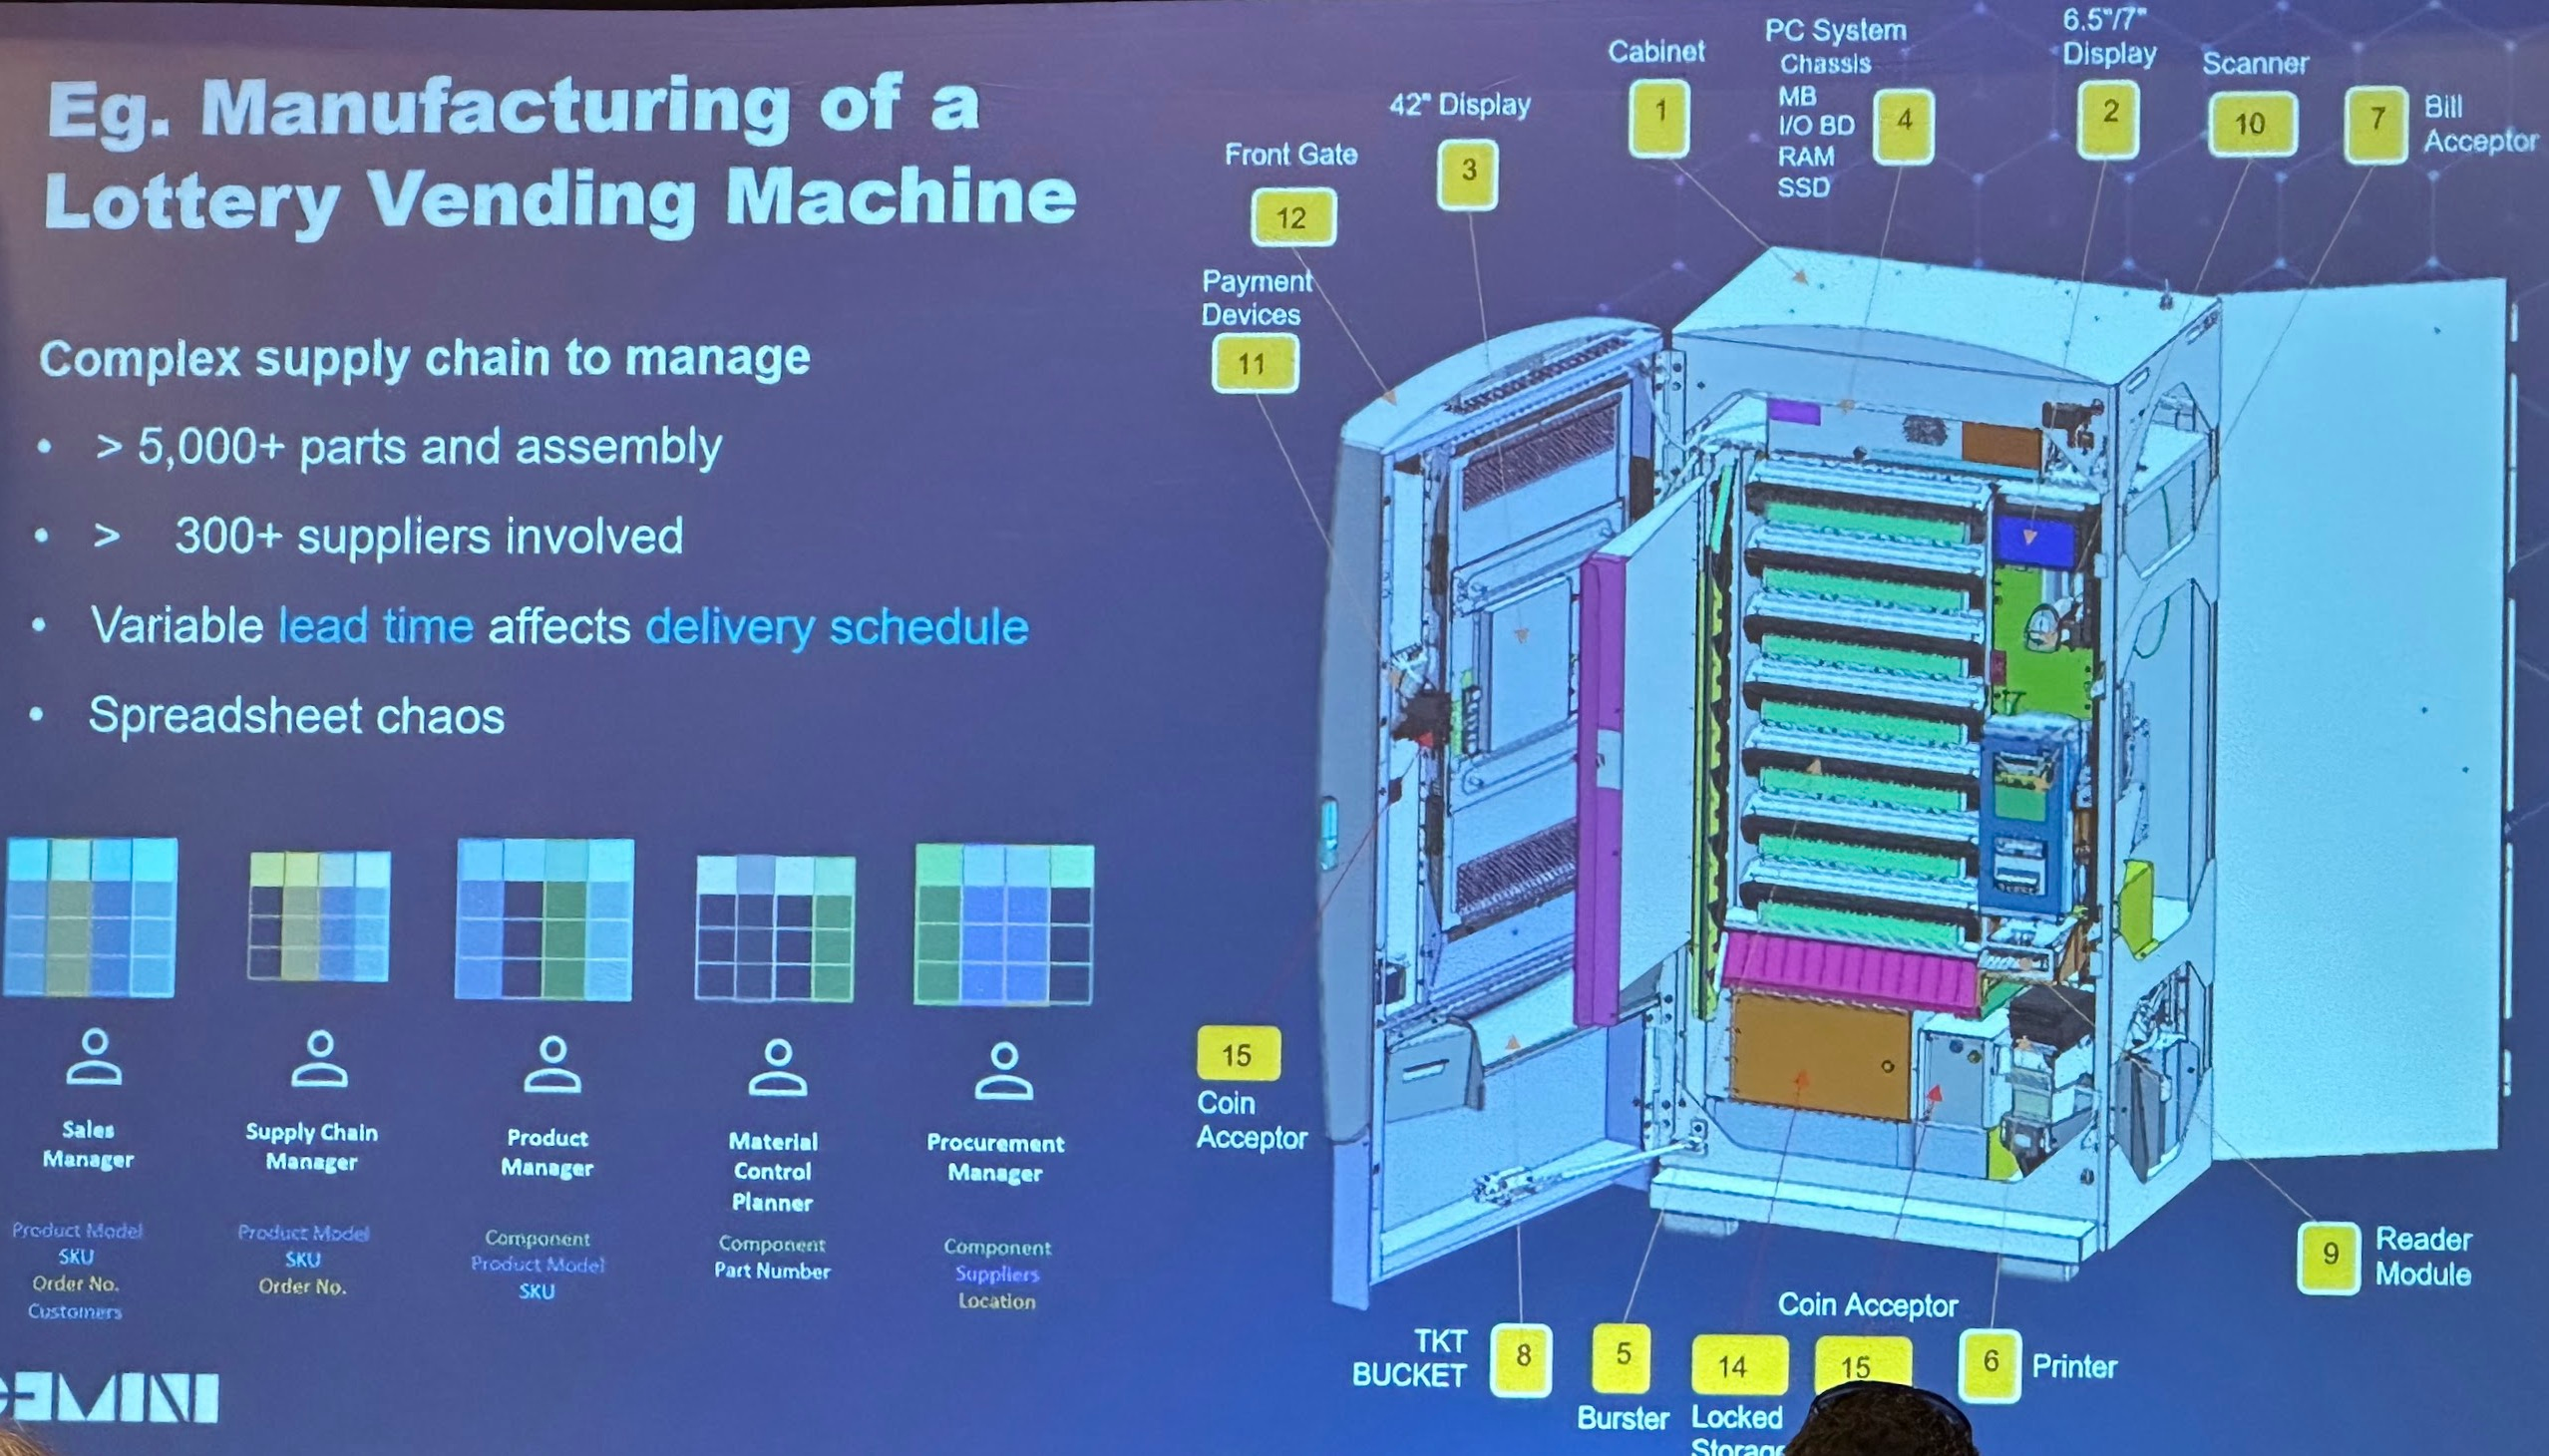
Meantime the complexity of product data and supply chain is skyrocketing. I was attending Neo4j Graph Data Summit earlier this week in Boston and captured the following slide from one of the presentations of Joe Fijak, Global EVP/COO, Ennoconn Corporation, and Gemini Data. What was remarkable is the story of how graph technologies provided by Neo4j can help to solve problems of supply chain analysis.
Unfortunately, product data is complex, and messy and resides a lot in Excel. The following picture speaks for itself – product lifecycle management and supply chain management are complex, but they’re even more complex in Excel data management.
PLM, Graph Databases, and Supply Chain Analysis
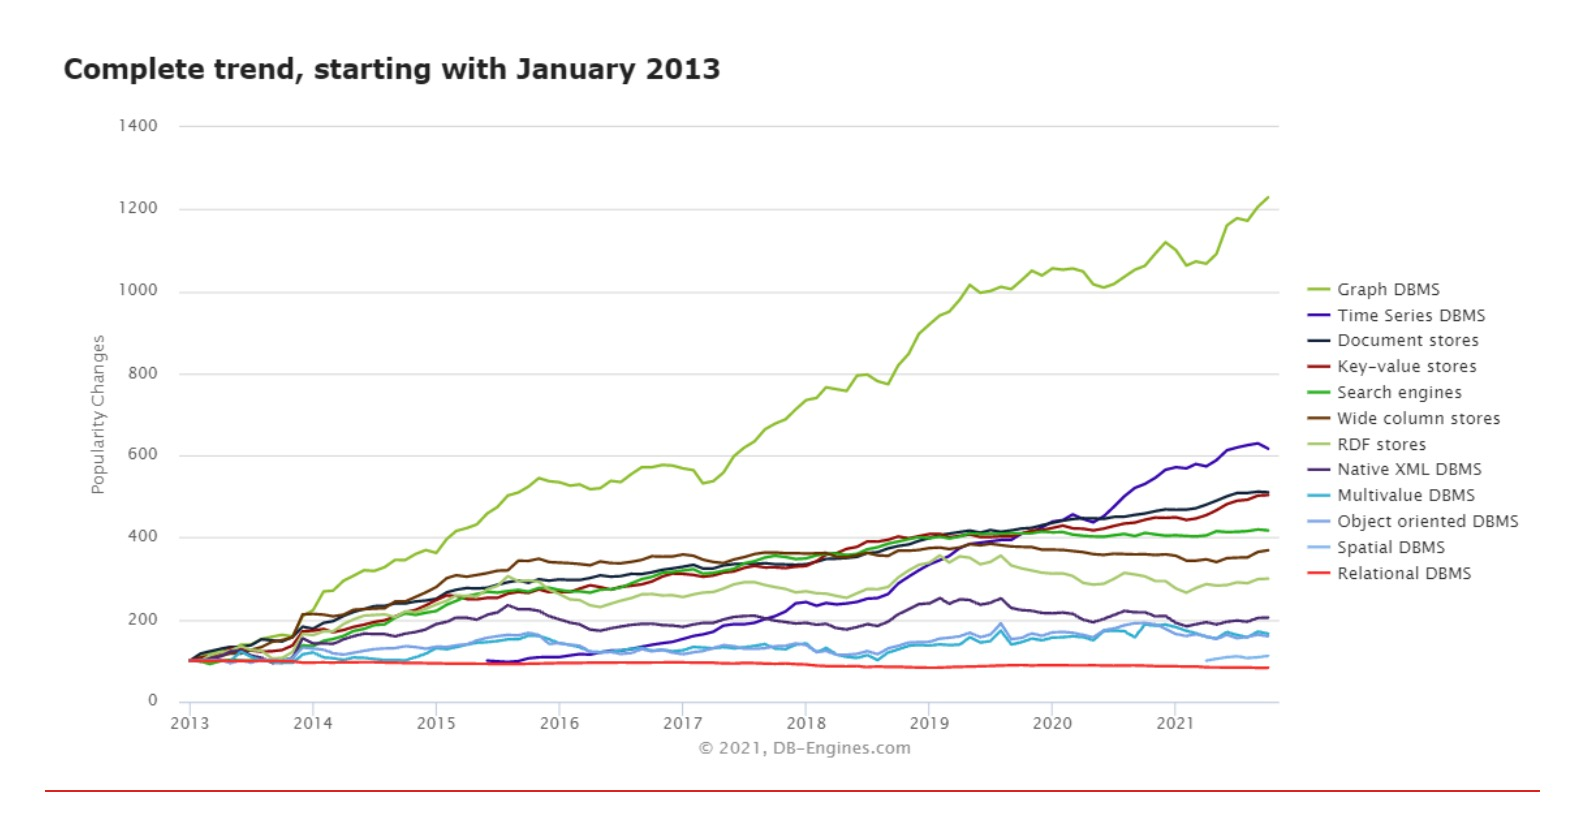
The power of graph databases and graph data science is remarkable when it comes to decision-making and analysis of complex information. Check my earlier blog – The importance of Knowledge Graph for Future PLM Platforms and What is wrong with all existing PLM Platforms. Yoann Maingon has a great example of the growing graph data ecosystem in his PLM stack blog – Graph ecosystem keeps growing.
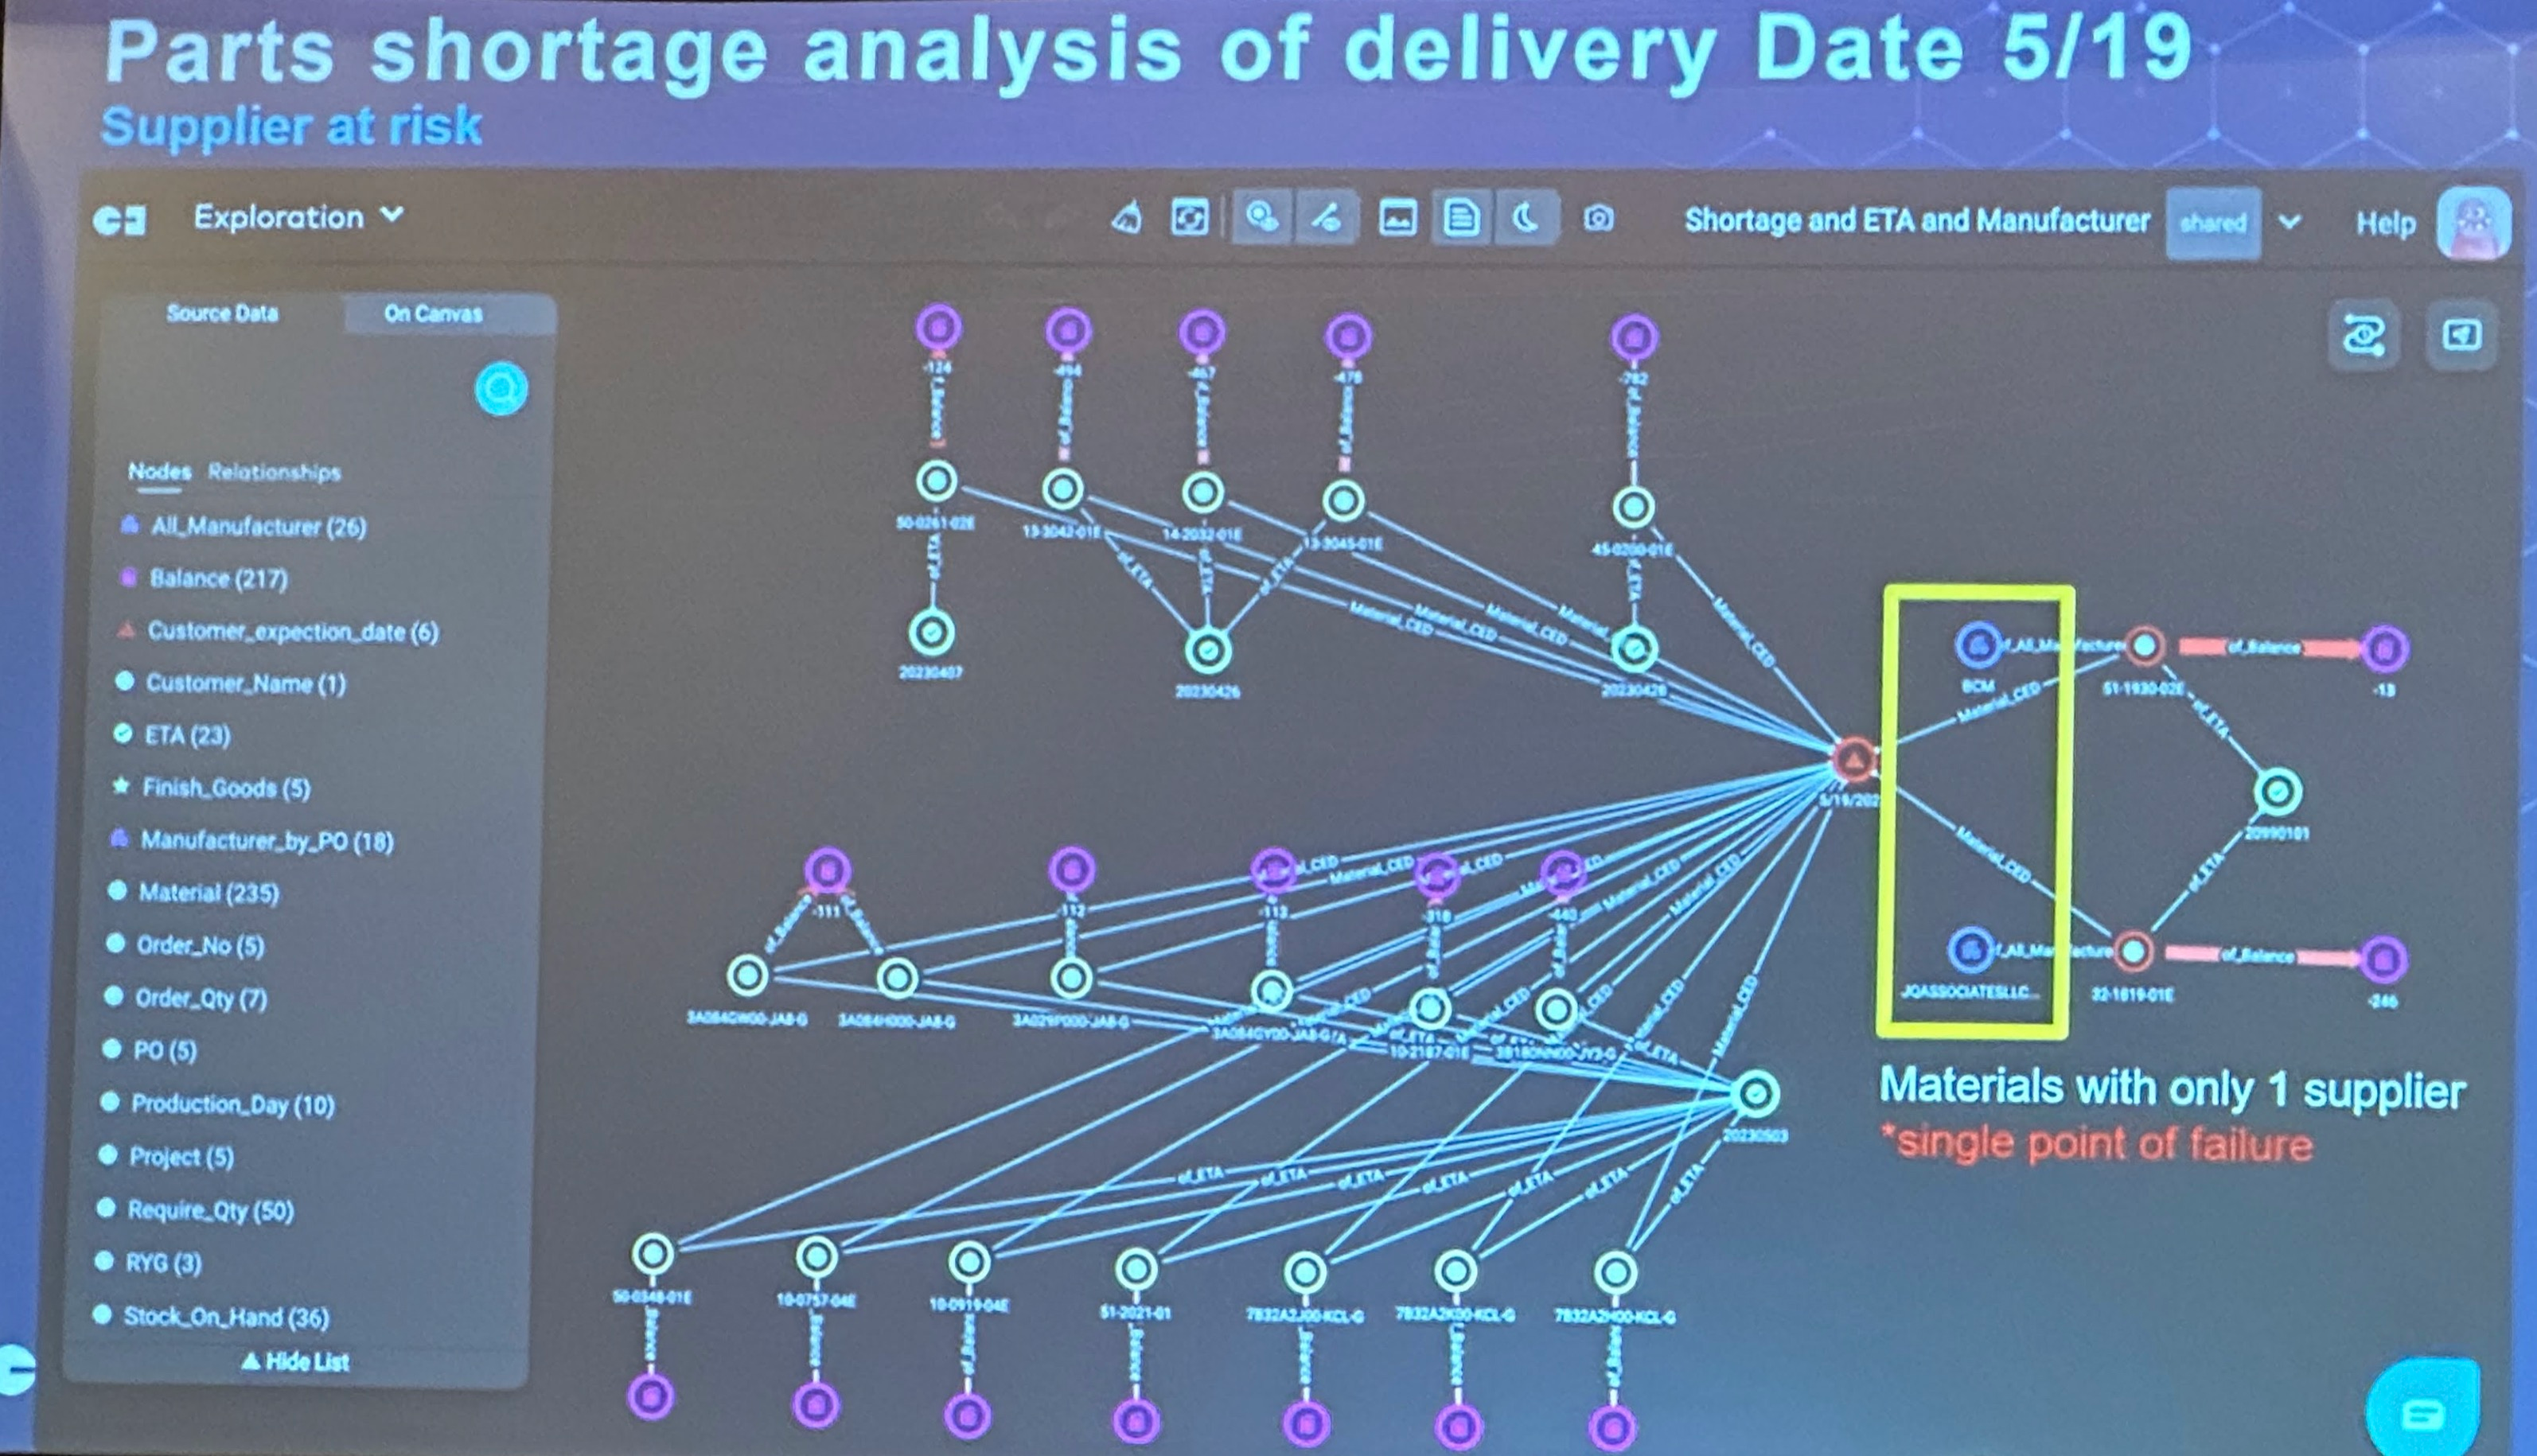
The following example is taken from the presentation by Joe Fijak at Neo4j Graph Summit can give you a perspective of how graphs can solve some of the product and supply chain bottlenecks.
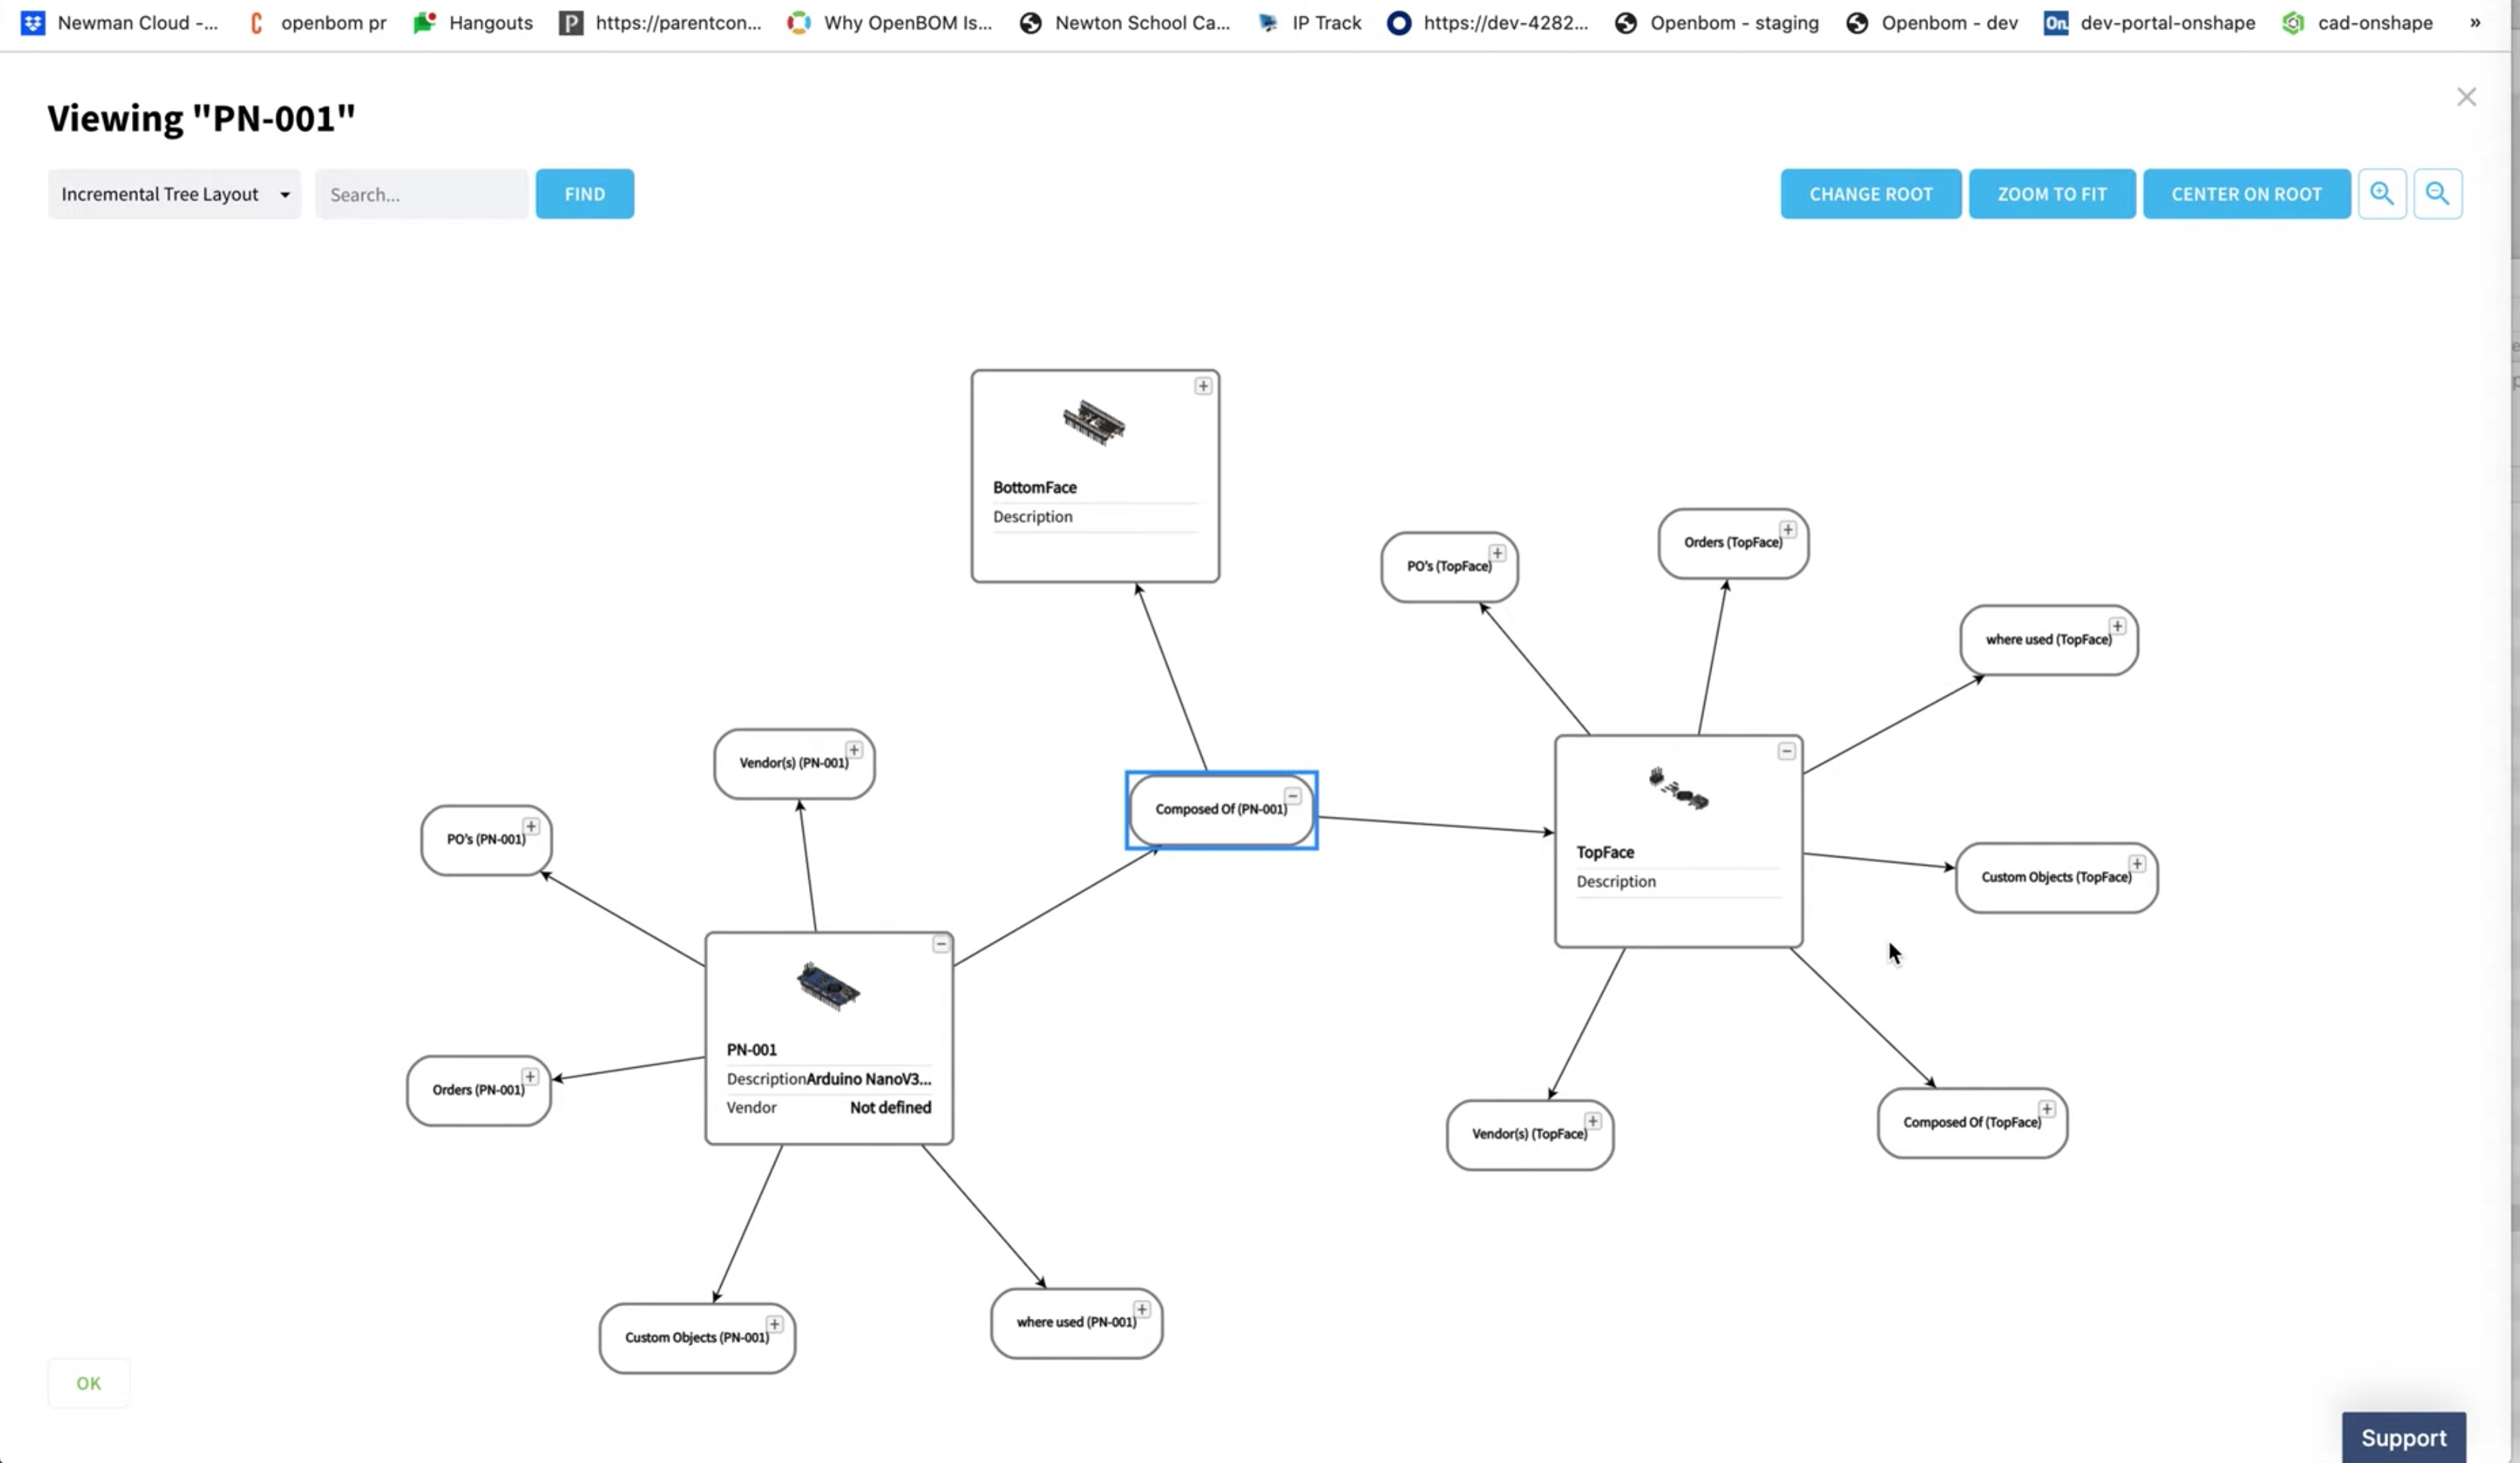
The opportunity for PLM vendors and technology to adopt new technological capabilities of modern PLM products using graph technologies. In my OpenBOM blog, I explained Why OpenBOM decided to use graph databases and why you need graph models to embrace product complexity (disclaimer – I’m OpenBOM co-founder and CEO). In our recent release, we introduced a preview of a graph navigator capable to trace and analyze multiple product dependencies.
Graph data science and tools are an opportunity for PLM software to become smarter and connect pieces of complex data together. While existing tools can provide graph visualization the underlining technologies will be limiting PLM tools not able to support graph algorithms and graph analysis. But it is a clear competitive advantage compared to traditional product data management. Manufacturing companies are looking for digital transformation, modern supply chain strategy, and usage of real-time data. Modern SaaS products are easier to integrate and use as connected data collaboration and analytics tools. This is a clear opportunity.
What is my conclusion?
Modern manufacturing brings complex data challenges that can be only resolved by modern data management technologies. Mature PLM platforms provide a foundation of product development by managing data and change processes but don’t have sufficient capabilities to model complex information, integrate information and perform analysis.
An example of reshoring is just one piece of modern manufacturing challenges. More to come in coming years because supply chain turbulence is here to stay. Complex change management, supply chain dependencies, and cost analysis – this is just a small example of challenges of modern manufacturing challenges. And we need modern and robust technologies to provide solutions to industrial companies.
Just my thoughts…
Best, Oleg
Disclaimer: I’m co-founder and CEO of OpenBOM developing a digital thread platform including PDM/PLM and ERP capabilities that manages product data and connects manufacturers, construction companies, and their supply chain networks. My opinion can be unintentionally biased.


